
Future of Energy-Efficient Products from E-Waste
E-waste is piling up, but the best near-term paths are already pretty clear: battery-to-battery recovery and rare-earth magnet recovery are closest to scale in the U.S., while PCB catalysts, carbon from spent batteries, and silicon/LED recovery are still earlier.
I’d boil the whole article down to this: the U.S. has a growing trash problem and a materials problem at the same time. In 2022, the world produced 62 million tonnes of e-waste, and only 22.3% was formally recycled. By 2030, that total could reach 82 million tonnes. So the main question is no longer just “How do we dispose of old electronics?” It’s also “Which waste streams can supply the next round of lower-power products?”
Here’s the short answer:
Best ready-now paths: battery cathode recovery and rare-earth magnet recovery
Best feedstocks: spent batteries, PCBs, hard drives, motors, PV panels, and LEDs
Main bottleneck: collection and sorting, not just plant capacity
Main rule for success: cleaner inputs lead to better outputs
Big U.S. issue: many routes work in pilots, but feedstock flow is still thin
Quick Comparison
Pathway | What goes in | What comes out | Where it stands now | Main limit |
|---|---|---|---|---|
Battery-to-battery | Spent Li-ion batteries | Cathode materials for new batteries | Closest to broader use | Not enough batteries collected |
Battery-to-supercapacitor | Spent battery graphite | Carbon electrodes | Lab to early pilot | Cost and uneven device performance |
PCB-to-catalyst/sensor | Circuit boards | Catalysts, sensor materials | Metal recovery is mature; end use is earlier | Impurities and buyer qualification |
Rare-earth recovery | HDDs, motors, EV parts | NdFeB magnets or RE oxides | Demo to early commercial | Teardown cost and low collection |
Silicon/LED recovery | PV panels, LED waste | Silicon, silver, gallium | Pilot-heavy for high-purity output | Clean separation and purity demands |
If you only need the headline, it’s this: the top paths are the ones that keep more of the original material form and purity, while the weaker paths still struggle with cost, sorting, or product fit. The rest of the article explains how those tradeoffs play out across performance, scale, and market use.
1. Battery-to-battery materials recovery
Battery-to-battery recovery pulls usable battery parts out of spent cells so they can go back into new ones. That includes cathode and anode materials, current collectors, and, in some cases, electrolytes.
Technology Readiness
Spent battery materials are usually handled through three main routes: pyrometallurgical smelting, hydrometallurgical leaching and separation, and direct recycling.
Pyrometallurgy and hydrometallurgy are already in use. But there’s a catch. Both routes break cathodes down and then build them back up from metals or salts. Direct recycling works differently. Instead of tearing everything apart, it aims to restore lithium and repair spent cathode powder so it can be reused in new cells. That approach has moved beyond lab work into pilot-scale and early industrial demonstrations, with a lot of activity around Ni-rich NCM and LFP chemistries.[8][9]
The big question now is simple: does that edge still hold once the process runs at full industrial scale?
Energy-Efficiency Impact
Direct recycling keeps the cathode’s morphology and composition in place. That means it can skip high-temperature smelting and avoid full re-synthesis steps. The result is lower energy use and lower greenhouse gas emissions than more common recycling routes.[8][10]
That sounds strong on paper. But lower energy use alone doesn’t decide the outcome. Supply volume and plant throughput will decide how far this can go.
Material Recovery Value and U.S. Scalability
The value of that energy savings depends on one basic thing: enough battery feedstock has to make it to recovery plants.
DOE funding is pushing battery-recycling scale-up in the U.S., including plants focused on graphite recovery and battery-grade materials.[13] On the processing side, gravity separation and froth flotation have reached up to 99% recovery and purity while keeping cathode structure intact. That gives recovered materials a real shot at going back into new high-performance cells.[12][11]
Still, the main holdup isn’t plant buildout. It’s getting enough material into the system. U.S. domestic battery shredding capacity was forecast at 230,000 tonnes in 2024, but only about 90,000 tonnes of scrap batteries were available. In plain terms, collection and pre-processing are still the bottleneck.[14][15]
2. Battery-to-supercapacitor carbon upcycling
After metal recovery, spent anode graphite is often downcycled or thrown away. Now, researchers are putting that carbon back to work as porous supercapacitor electrodes. The big issue is cost: can that upgrade be done cheaply enough to make sense in actual products?
Technology Readiness
This route sits at about TRL 4–6. In plain English, that means it has been tested in labs and small pilot settings, but it still isn't in broad commercial use.[16][19][21] Researchers have already shown that recovered anode graphite can be turned into working supercapacitor electrodes.[16][20] A 2026 study pushed things further by making electronic-grade graphene ink for printed planar micro-supercapacitors, with cycling stability past 10,000 cycles.[21]
Still, this isn't as simple as shredding old battery material and calling it done. Most processes need activation, pore tuning, or composite design to get the right electrochemical behavior. Common approaches include:
Ball milling
Supercritical water exfoliation
Oxidation-reduction treatment
Each extra step can improve performance, but it also adds cost and processing time.[16][19]
Energy-Efficiency Impact
Bench-scale numbers look strong, but full-cell performance is what counts. One study using supercritical water exfoliation of spent Li-ion anodes reported a specific capacitance of 351 F/g at 2 A/g, compared with 289 F/g for untreated spent material.[19] That's a solid jump.
But single-electrode tests only tell part of the story. In the end, actual devices have to deliver. An asymmetric device made with regenerated electrodes reached an energy density of 23.9 Wh/kg at 450 W/kg and held that performance over 8,000 cycles.[17]
There is, however, an important reality check. A 2025 review of waste-derived activated carbons found that performance often slips when researchers move from single-electrode lab testing to full two-electrode devices. In real cells, results often land in the 100–150 F/g range.[22] If you're looking at commercial promise, that gap matters.
Material Recovery Value and U.S. Scalability
Carbon upcycling can open a second revenue stream from graphite that might otherwise be sold as low-value filler or discarded. Instead of treating it like leftover material, recyclers can turn it into higher-performance energy storage carbon with a higher selling price.[16][19]
That matters even more as the U.S. battery-recycling market grows, since a larger recycling base means more anode carbon available for higher-value recovery.[23][24] The hard part is fitting this step into the process flow. Carbon upcycling usually comes after metal leaching, so it has to be built into hydrometallurgical operations from the start, not tacked on later.[16][18][20]
3. PCB-to-catalyst and sensor materials
Printed circuit boards are rich feedstock. Metals account for 30%–40% of board weight, including 16%–25% copper plus gold, silver, and palladium.[5] That mix makes PCBs one of the more useful e-waste streams for turning into catalysts and sensor platforms. So the upside isn't just metal recovery. It's also the chance to make high-performance catalyst and sensor feedstocks from material that would otherwise be discarded.
Technology Readiness
Metal-to-catalyst pathways are among the most developed routes in e-waste upcycling.[5][7] A well-known example is the Cu-iKat catalyst. It is made by precipitating copper leachate from mobile phone PCBs onto γ-alumina, and it shows activity similar to standard Cu catalysts. It also produces gold-enriched solids as a byproduct.[26] In another case, a PCB-derived CuFe₂O₄ catalyst performed better than a virgin-copper analog in dye degradation.[33]
The non-metal fraction is starting to matter too. Resin and glass-fiber fractions are now being turned into porous carbons with high surface area and strong CO₂ uptake, reaching 2,270 m²/g and 5.17 mmol/g at 32°F (0°C) for CO₂ adsorption.[34] That’s a big shift. What used to look like leftover board waste is now being tested as a useful support material.
Right now, PCB-derived catalyst supports have moved past early proof-of-concept and sit around TRL 4–6, while sensor routes are still earlier at about TRL 2–4.[28][5][27][29][30] On the sensor side, gold and palladium recovered from PCBs can be made into nanoparticles and thin films for low-power gas and electrochemical sensing.[5][27][29][30] The main open issue is scale. Lab results can look strong, but steady industrial supply is a different game.
Energy-Efficiency Impact
These pathways can cut energy use in two main ways.
First, turning PCBs into catalysts and sorbents avoids part of the energy burden tied to mining and refining virgin metals. Life-cycle studies show lower environmental and energy footprints when green recovery methods such as biohydrometallurgy or tannic-acid-assisted leaching are used.[5][30][31]
Second, the recovered materials can make later processes use less energy. PCB-derived catalysts are being used in water splitting, CO₂ reduction, and green hydrogen generation, where better reaction selectivity can lower energy input for each unit of output.[25][32]
That value logic is important. The next move is not just selling recovered metals as bulk material, but turning them into higher-margin products.
Material Recovery Value and U.S. Scalability
Selling recovered copper as a commodity is fairly direct. But converting that copper into a specialized electrocatalyst or sensor material can lift the value per unit by a lot. The same applies to gold and palladium recovered from PCBs and processed into nanoparticles active in CO oxidation, CO₂ reduction, and gas detection.[25][27]
In the United States, e-waste generation reached 7,188 kilotons in 2022, and PCBs make up a high-value share of that stream.[35] Scaling PCB-to-catalyst pathways depends on a few plain factors: a steady feedstock supply, consistent dismantling, and downstream ties with chemical manufacturers or research institutions. Certified handlers such as Rica Recycling can help with selective dismantling and feedstock preparation for PCB upcycling under California rules.[30][31]
That same mix of performance, readiness, and scale shows up again in rare-earth recovery for motors and generators.
4. Rare-earth recovery for efficient motors and generators
Like PCB metals, rare-earth magnets can turn discarded electronics into feedstock for higher-efficiency hardware. The main rare earths in this stream are neodymium (Nd), praseodymium (Pr), dysprosium (Dy), and terbium (Tb).[43][46] These elements are used in neodymium-iron-boron (NdFeB) permanent magnets found in high-efficiency motors and generators for EVs, wind turbines, HVAC compressors, and industrial drives.[43][46] Permanent magnet synchronous motors (PMSMs) that use these magnets often reach 94–97% efficiency. That is about 8–12 percentage points higher than similar induction motors.[44][45][48]
Technology Readiness
The best feedstocks are end-of-life products that contain high-value permanent magnets. The top targets are:
Hard disk drives (HDDs)
Cordless-tool motors
EV traction motors
Wind-turbine components
HDDs are the most practical early target because their magnets are easier to remove. EV and wind-turbine systems hold much larger volumes, but they are tougher to take apart.
Hitachi’s automated HDD disassembly system increased magnet collection from about 12 units per hour to around 100. Over six years, from FY2013 to FY2019, it recovered about 26 metric tons of magnets.[36][37][38] In lab-scale hydrometallurgical tests, Hitachi’s process recovered about 95% of Nd and Dy from that scrap.[39]
Recovery methods fall into three broad tiers. Direct magnet reuse uses the least energy when magnets can be removed intact and still meet specs. Magnet-to-magnet recycling turns scrap magnets into new magnets with limited material loss. Chemical recovery, including hydrometallurgy and membrane solvent extraction (MSX), works better for mixed or degraded feedstocks, though it usually takes more reagents and energy.[41]
One MSX process reached more than 99.5 wt% purity and more than 95% yield of recovered rare-earth oxides at a pilot capacity of roughly 300 kg of REOs per month.[41] Ames Laboratory’s leaching process reached about 90% efficiency at industrial scale when treating magnets in shredded HDDs.[3]
Put simply, the closer a process stays to an intact magnet, the lower the energy cost and the higher the product value.
Energy-Efficiency Impact
Recycled rare-earth magnets help preserve high-performance motor designs. In day-to-day use, that can mean smaller motors, better torque density, and lower electricity use in vehicles, HVAC systems, and industrial equipment. PMSMs in EV drivetrains can reach 95–97% efficiency, and field data show permanent-magnet motors saving about 7.3 kWh per day for each 10 hp compressor when compared with IE4 induction motors.[45]
Material Recovery Value and U.S. Scalability
The end-of-life recycling rate for these magnets was under 1% in 2019.[49] Even so, NdFeB magnets could meet 12–70% of U.S. EV magnet demand by 2050 if collection and recycling rates improve.[40] Global demand for REE magnets reached roughly 93,000 metric tons in 2023 and is projected to rise to 131,000 metric tons by 2030.[47]
In the U.S., scaling depends on better collection systems, more standardized dismantling, and steady downstream demand for recovered magnets used in efficient motors and generators. Certified electronics recyclers like Rica Recycling can route magnet-bearing devices into compliant recovery streams. The longer-term picture gets better if manufacturers design motors and generators so magnets are easier to remove. That cuts processing costs and helps recovered rare-earths compete with virgin material.
That supply gap is the main barrier to scaling this route.
5. Silicon and semiconductor recovery for LEDs and photovoltaics
If rare-earth recovery is hard because of teardown, silicon and LED recovery is hard for a different reason: you need clean separation and very high purity. Silicon still sits at the heart of solar cells and electronics, but most recycling today goes after bulk materials like glass and aluminum first. That leaves a big opening. High-value silicon, gallium, and silver can be pulled back into LED and PV manufacturing, which makes this route stand out for purity, market value, and a fast-growing U.S. waste stream.
Technology Readiness
Solar recovery usually starts with discarded crystalline silicon (c-Si) modules. Recyclers remove the frames, junction boxes, and glass first, then move on to silicon extraction. Chemical etching strips away coatings, contacts, and aluminum so the silicon can be reused.
Results here are strong. One deep-etching study reached 96.45% silicon recovery at 99.98 wt% purity and 99.87% silver recovery. A newer deep eutectic solvent method recovered silicon wafers at 97.47 wt% purity with 99.41% retention, which opens the door to near-lossless wafer reuse.[50][53] Fraunhofer CSP has also shown that new PERC solar cells can be made from 100% recycled silicon.[60]
The same basic idea applies to LED waste, but the target changes. Here, gallium is the main prize. Processing waste white surface-mount LEDs can deliver up to 99% gallium enrichment in the non-conductive fraction, making it fit for reuse in LED epitaxy.[52][54] The UK-funded ReGaIL project is now looking at paths to bring that process to market.[52] At this stage, silicon PV recovery is closer to commercial use, while LED semiconductor recovery has been proven in pilot work but hasn't reached full commercial rollout yet.
Energy-Efficiency Impact
The gains here show up less in direct plant energy use and more across the full life cycle. When recycled silicon goes back into new solar cells, manufacturers avoid part of the heavy energy burden tied to primary silicon production.
One LCA study found that recycling can cut terrestrial ecotoxicity by 74% and lower greenhouse gas emissions by 24% across the life cycle of PV modules compared with landfilling.[55][56] Another chemical recycling process reported offsets of about 231–252 kg CO₂-eq for each kilogram of end-of-life silicon solar cells treated because it avoids primary material production.[51]
For LEDs, the picture is similar. Purified recovered gallium can go back into epitaxial growth with quality on par with virgin material, which supports high-efficiency device production without hurting performance.[52][54]
Material Recovery Value and U.S. Scalability
These waste streams get more attractive when recovery is handled as one integrated process. Instead of pulling out just one material, operators can recover silicon, silver, aluminum, and gallium from the same stream and sell into several end markets.
Projections suggest recycled PV materials could supply over 20% of PV industry demand for aluminum, copper, glass, and silicon, plus nearly 70% of silver demand, between 2040 and 2050.[55][56] That's not a small side stream. It's a meaningful slice of future material supply.
The U.S. feedstock base is also growing fast. NREL's PV ICE modeling estimates that end-of-life c-Si PV modules will hit about 87,000 metric tons per year by 2030 and 820,000 metric tons per year by 2050.[57][58] On the policy side, the U.S. EPA has been working to bring waste PV panels into the universal waste framework, which would make collection easier across the country and lower friction for recovery programs.[59]
In California, certified recyclers like Rica Recycling can act as regional aggregation points for PV and LED waste streams. That matters because high-purity semiconductor recovery only works when material gets routed to the right downstream partners instead of being mixed into lower-value recycling channels.
How the Five Pathways Compare: Performance, Readiness, Value, and Scale
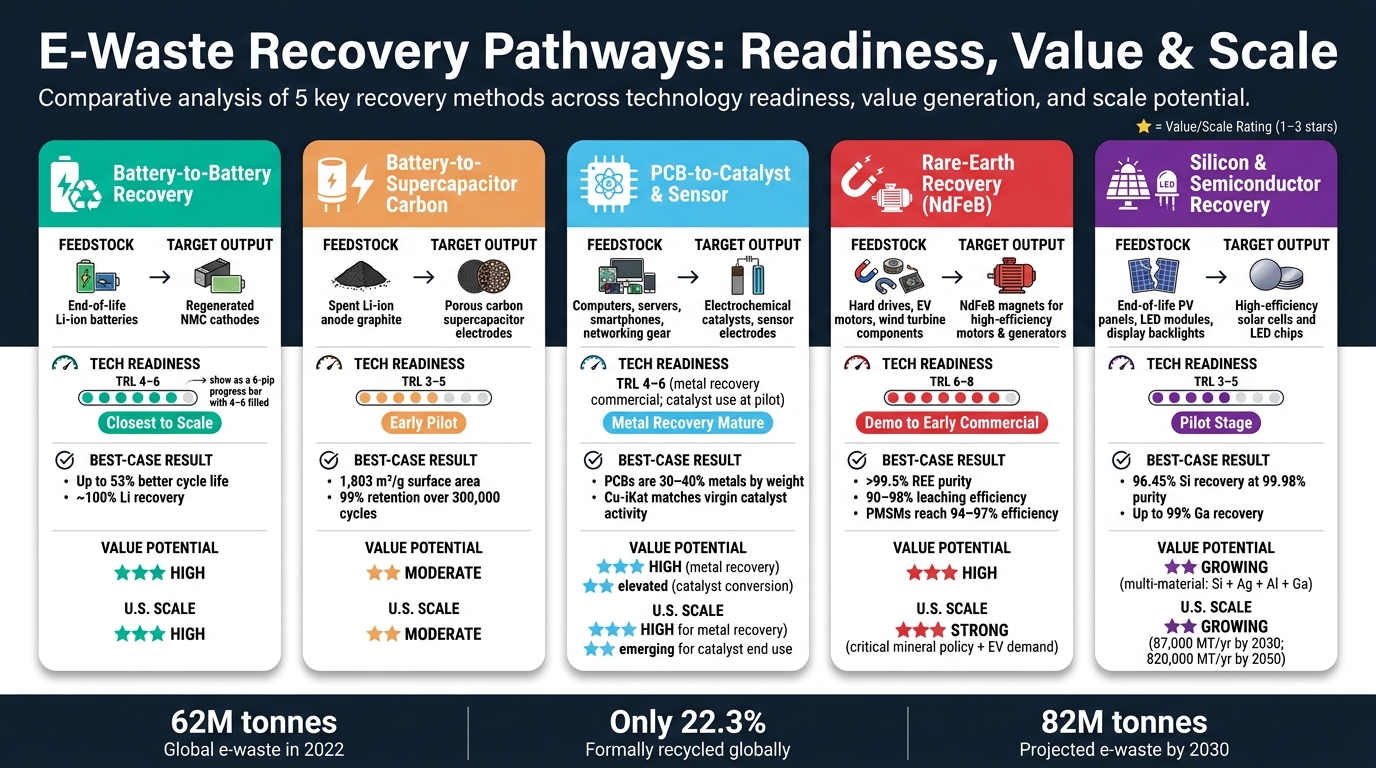
E-Waste Recovery Pathways: Readiness, Value & Scale Compared
After the pathway-by-pathway analysis above, this side-by-side view shows where each route stands right now.
Pathway | Primary Feedstock | Target Product | Best-Case Result | Technology Readiness | Value/Revenue Potential | U.S. Scale Potential |
|---|---|---|---|---|---|---|
Battery-to-battery (Ni, Co, Mn, Li) | End-of-life Li-ion EV, consumer-electronics, and storage batteries | Regenerated NMC cathodes for Li-ion cells | Up to 33–53% better cycle life vs. state-of-the-art commercial material; nearly 100% Li recovery and about 91–93% Ni, Mn, and Co recovery [61][64][65] | 4–6 (lab to pilot) | High; cathode-grade materials command premium pricing over bulk metal sales | High; active pilots and strong policy support |
Battery-to-supercapacitor (carbon) | Spent Li-ion, zinc–carbon, and alkaline batteries | Porous carbon supercapacitor electrodes | Up to 1,803 m²/g surface area; 31.83 Wh/kg energy density; 99% capacitance retention over 300,000 cycles [66][67][6] | 3–5 (lab to early pilot) | Moderate; second revenue stream from anode graphite otherwise sold as low-value filler | Moderate; growing feedstock, limited commercial lines |
PCB-to-catalyst and sensor materials (Cu, Au, PGMs) | Computers, servers, smartphones, networking gear | Electrochemical catalysts, sensor electrodes | High value despite low mass; recovered precious metals can approach primary-source catalyst activity [7] | 4–6 (metal recovery commercial; catalyst use at pilot) | High for metal recovery; elevated margins when metals are converted to catalysts or sensor materials rather than sold as commodities | High for metal recovery; emerging for catalyst end use |
Rare-earth recovery (Nd, Dy, Pr, Tb) | Hard drives, small motors, EV and hybrid drivetrains | NdFeB magnets for high-efficiency motors and generators | 90–98% leaching efficiency; supports magnet remanence and coercivity for compact, high-torque motors [3] | 6–8 (demonstration to early commercial) | High; recovered NdFeB magnets feed EV and wind supply chains facing critical mineral shortages | Strong; critical mineral policy and EV supply chain demand |
Silicon and semiconductor recovery (Si, In, Ga) | End-of-life PV panels, LED modules, display backlights | High-efficiency solar cells and LED chips | Over 95% indium recovery; up to 99% gallium recovery from GaN/GaAs LEDs [62][63] | 3–5 (mechanical recovery commercial; semiconductor-grade recovery at pilot) | Growing; multi-material recovery from a single stream - silicon, silver, aluminum, and gallium - spreads value across several end markets | Growing; large future feedstock, limited specialized facilities |
The ranking is pretty clear.
Battery-to-battery recovery is the closest to large-scale commercial use. It pairs strong technical results with active pilot work and policy tailwinds. Right behind it is rare-earth recovery, which matters a lot for EV motors and wind equipment. PCB metal recovery is already mature on the extraction side, but using those recovered metals in catalysts and sensors is still earlier-stage. Carbon upcycling and semiconductor recovery are further back, mostly because commercial rollout is still limited.
That gap in readiness isn't just about who gets to market first. It also maps to energy outcomes. Better battery materials can mean longer cycle life. Better rare-earth magnet recovery can help cut motor losses. Reused PCB metals can lower catalyst energy demand. And cleaner recovery of silicon, indium, and gallium can reduce embodied energy in PV and LED manufacturing.
Those performance differences set up the tradeoffs in the pros-and-cons comparison below.
Pros and Cons of Each E-Waste-to-Efficiency Route
The table gives you the headline view. The trade-offs below show why each route lands where it does.
Pathway | Major Benefits | Major Limitations | Environmental Upside | Commercialization Barriers |
|---|---|---|---|---|
Battery-to-battery recovery | High-value metals such as lithium, cobalt, nickel, manganese, and zinc; established pyrometallurgical and hydrometallurgical routes, plus emerging direct recycling; near-term feasibility | Energy-intensive pre-treatment; hazardous chemical use; strict purity requirements for battery-grade cathode materials | Lower emissions than virgin mining; reduces supply risk and cost volatility | High capital costs; mixed feedstock complicates quality control; regulatory compliance for chemical handling |
Battery-to-supercapacitor carbon | Uses carbon-rich waste fractions that might otherwise be discarded; tailored porosity can match or exceed conventional carbons | Mostly lab-scale; inconsistent output from heterogeneous waste; lower near-term revenue than metal recovery | Diverts plastics and carbon fractions from landfill or incineration; reduces demand for fossil-based precursors | Limited commercial lines; standardization is still limited; slow investment due to modest near-term margins |
PCB-to-catalyst and sensor materials | Converts mixed-metal waste into high-value materials such as Cu-iKat from mobile phone PCBs; broad application space | Brominated flame retardants and resins complicate separation; sensor and catalyst performance drops with impurities | Avoids landfilling and supports higher-value use of PCB fractions | Market qualification hurdles; customers want long-term reliability data before adopting upcycled catalysts and sensors |
Rare-earth recovery (NdFeB) | High supply-chain value; lab processes achieve more than 99.5% REE purity; direct feed into EV and wind supply chains | Magnet extraction can account for 40% to 55% of total recovery cost; neodymium oxide prices are volatile | Very high; can save 80% to 90% of energy compared with primary mining; reduces dependence on imported critical minerals | Low collection rates, often below 20%; high dismantling costs; iron and boron impurities require additional refining |
Silicon and semiconductor recovery | Reduces the energy burden of primary silicon and semiconductor production; supports LED and PV supply chains | Damage and contamination limit reuse; older wafers may not fit current production lines | Preserves high embodied energy when direct reuse is possible; greener solvents can reduce reliance on HF/HCl leaching | Scalable high-purity recovery is still emerging; complex multilayer device structures limit direct device reuse |
Battery and rare-earth routes are the closest to scale. They also come with the heaviest processing burden: high energy use, chemical handling, and tight purity targets. By contrast, carbon upcycling routes look strong in lab results, but they still have to show they can deliver steady commercial volumes.
A lot of this comes down to input quality. Poor sorting drives up impurity loads, recovery costs, and output swings. Clean feedstock is what makes battery, PCB, magnet, and semiconductor recovery work at commercial-grade quality. For California organizations, certified landfill-free collection helps keep materials clean and traceable. Rica Recycling is one example of compliant collection in the Bay Area. [68][1][2][69]
There’s also a design issue that cuts across every route. Standardized magnet formats, modular battery packs, and separable PCB layers can lower recovery costs in a meaningful way, especially in rare-earth and direct-recycling systems where dismantling is a major cost driver. [70][42][4] Design for disassembly reduces cost and friction across the highest-value recovery paths. That choice has a big effect on how well each route scales.
Conclusion
Put side by side, the picture is pretty clear: some paths are ready now, while others still need time. Battery-to-battery recovery and rare-earth reuse are closest to scaling. PCB-derived catalysts and semiconductor recovery are earlier-stage paths where the science is moving forward, but market proof is still missing.
What decides whether the U.S. can close that gap? Four things matter most:
Clean, well-sorted feedstock helps keep the purity needed for battery-grade materials, magnet recovery, catalyst feedstocks, and semiconductor recovery.
Design for disassembly cuts recovery costs across each high-value path.
Domestic processing capacity supports supply chains and reduces reliance on overseas refining.
Circular procurement gives these systems the buyer demand they need to work at scale.
Those are the levers that move a process from the lab to the factory floor. For Bay Area organizations, a practical starting point is certified, landfill-free collection that keeps feedstock clean and traceable - Rica Recycling is one example of compliant collection in the region.
Right now, technology is moving faster than collection and processing capacity. That mismatch matters. Certified collection, domestic processing, and circular procurement will shape whether these routes remain experimental or become standard practice.
FAQs
Why is collection the biggest bottleneck?
Collection is the first step in material recovery, and it's also the biggest choke point. The main reason is simple: participation is low. Even though a huge volume of electronics gets thrown away each year, only about 25% of e-waste is collected for recycling.
There’s another problem too. E-waste is spread out across homes, offices, and storage closets all over the place. That means recovery doesn’t happen on its own. It takes coordinated drop-off sites, community collection events, and pickup programs to gather these materials and keep valuable, finite resources out of landfills.
Which e-waste pathways are closest to scale today?
Refurbishment is the most scalable path for devices that still work, and it has a major effect on emissions. It extends a device’s life, delays the need for new production, and can cut a device’s carbon footprint by 77% to 91%.
For electronics at end of life that can’t be repaired, material recovery is the standard path. In plain terms, the device gets broken down through industrial shredding and separation systems so metals like copper, silver, and gold can be pulled out and used again.
How does cleaner feedstock improve recycled products?
Cleaner feedstock leads to better recycled products because it improves material purity and overall quality. With advanced sorting, recyclers can reach up to 99% metal purity, which gives manufacturers stronger secondary raw materials for new production.
High-purity recycled materials can also reduce the carbon footprint of new products by 60% to 90% compared with virgin materials. And when contamination is lower, recyclers are less likely to face rejected material streams. It also helps keep hazardous substances out of final products.