
Guide to Universal Recycling Metrics
If you can’t prove where retired devices went, your numbers don’t mean much. I’d boil this guide down to six things you should track every time: collection rate, recycling rate, reuse rate, landfill diversion, data destruction, and chain-of-custody.
Here’s the short version:
Collection rate shows how much e-waste you got into a formal program
Recycling rate shows how much of that collected material went to recycling
Reuse rate shows how much was tested, repaired, or refurbished instead of broken down
Landfill diversion shows how much stayed out of disposal
Data destruction shows whether data-bearing devices were wiped or destroyed
Chain-of-custody shows whether you have records from pickup to final processing
The article also makes three big points:
You need fixed definitions so sites and vendors report the same way
You need proof records like weigh tickets, serial logs, and destruction certificates
You need to line up internal reports with U.S. and California rules, especially if you handle large volumes
A few numbers make the case fast: in 2022, only 22.3% of 62 million metric tons of global e-waste was formally collected and recycled. And in California, violations can reach $25,000 per violation per day.
If I were setting up a simple framework from this guide, I’d use one unit of measure, one denominator per metric, monthly vendor checks, and shipment-level ITAD records.
What to track | What it tells you | Basic proof |
|---|---|---|
Collection | How much e-waste entered the program | Weigh records, intake logs |
Recycling | How much collected material went to recycling | Recycler reports, downstream records |
Reuse | How much was prepared for another use | Refurbishment logs, asset status |
Diversion | How much stayed out of landfill | Processing summaries, residual records |
Data destruction | Whether data was wiped or destroyed | Sanitization or destruction certificates |
Chain-of-custody | Whether custody was documented end to end | Pickup logs, serial records, audit trail |
So the core idea is simple: track the same numbers, the same way, every time, and keep the paperwork to prove them.
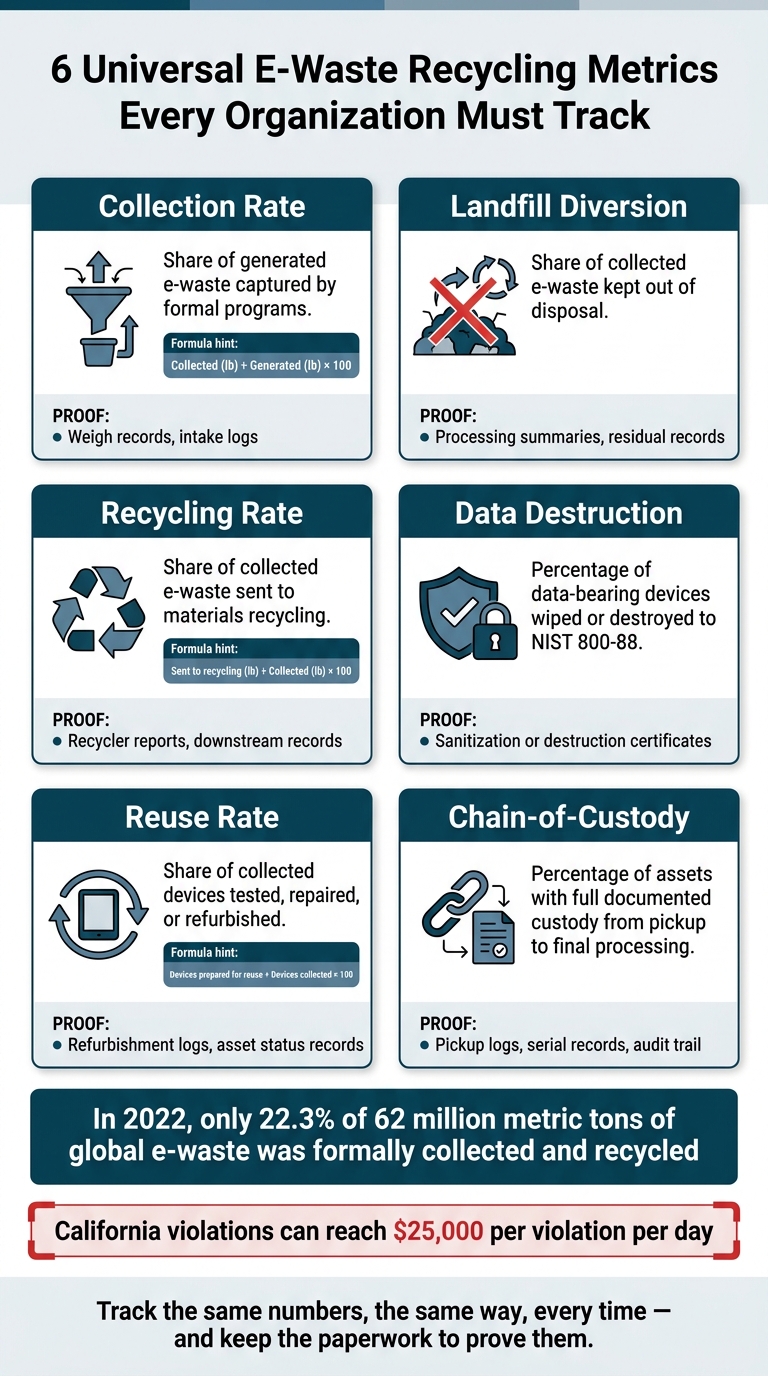
6 Universal E-Waste Recycling Metrics Every Organization Must Track
Standards and Rules Behind Recycling Metrics
Global Frameworks That Shape Common Definitions
Several international frameworks set the terms used in recycling reporting.
UN SDG indicator 12.5.1 defines the national recycling rate as domestic recycled material plus exports for recycling, minus imports, divided by total waste generated. It also leaves incineration and land application out of the recycling numerator.[4][6][5]
The ITU e-waste guidelines use a different metric. They define the collection rate as e-waste collected through formal systems divided by total e-waste generated.[11]
The EU WEEE Directive goes another way. It ties collection targets to equipment placed on the market in the prior three years, not only to waste generated.[15]
OECD waste statistics add an important line in the sand: recycling means waste that is actually reprocessed into products, materials, or substances, not material that was simply sent to a facility.[7][8][9]
For organizations benchmarking against the SDGs, this shared language matters. When internal metrics line up with SDG 12.5.1 or ITU definitions, cross-location dashboards are easier to compare, and sustainability disclosures carry more weight.
These definitions set the basis for measurement. The next set of standards deals with how data is collected and checked.
Reporting Standards Used in Practice
Once the metric basis is set, ISO and WARM help turn it into repeatable reporting.
ISO 14031:2021 gives organizations a structured way to evaluate environmental performance by separating operational performance indicators from management performance indicators. For electronics recycling and ITAD, operational indicators can include pounds of e-waste recycled, the percentage of hazardous fractions properly treated, and the share of downstream vendors with third-party certifications. Management indicators cover non-compliance incidents and corrective actions.[10]
The EPA Waste Reduction Model (WARM) converts processing data into outcome metrics. Organizations enter tonnages managed through recycling versus landfilling, and WARM outputs metric tons of CO₂-equivalent avoided and energy savings in million BTUs. Annual data is easier to compare year over year when it is broken into WARM-ready categories such as:
ferrous metals
non-ferrous metals
plastics
office equipment
That way, the numbers aren’t just piles of tonnage. They show what those tons mean in practice.[16][17][18][19]
California and U.S. Reporting Considerations
Local reporting rules still need to map back to these shared definitions.
In California, the e-waste program requires annual reports from facilities that collected more than 220 pounds of e-waste from off-site sources or generated more than 11,000 pounds on-site. Those filings are due by February 1 of the following year.[1][2][3][12][13]
California reporting should also track the share of covered devices processed through compliant channels, downstream destinations for hazardous fractions such as CRT glass and batteries, and data security results. That includes the percentage of data-bearing devices with certified destruction, the destruction method used, and the share covered by chain-of-custody documentation.[14]
These reporting rules define the inputs. The next section turns those inputs into core performance metrics.
Core Metrics for Electronics Recycling and ITAD
Collection, Recycling, Recovery, and Reuse Rates
Use these metrics to compare vendors, track internal performance, and report results the same way across sites.
These rates are not the same thing. If you swap them around, reporting gets muddy fast.
Metric | Definition | Formula | Unit | Use |
|---|---|---|---|---|
Collection rate | Share of generated or eligible e-waste captured by formal programs | Collected (lb) ÷ Generated (lb) × 100 | % | Evaluates take-back programs, office cleanouts, and school refresh cycles |
Recycling rate | Share of collected e-waste sent to materials recycling | Sent to recycling (lb) ÷ Collected (lb) × 100 | % | Assesses vendor performance and zero-landfill alignment |
Recovery rate | Share of collected e-waste converted into usable material streams; state separately whether energy recovery counts | Recovered materials (lb) ÷ Collected (lb) × 100 | % | Measures how well processing turns waste into usable commodities |
Preparation-for-reuse rate | Share of collected devices tested, repaired, or refurbished and made ready for reuse | Devices prepared for reuse (count) ÷ Devices collected (count) × 100 | % | Tracks circular-economy outcomes before defaulting to recycling |
Here’s a simple example. A 10,000 lb refresh cycle with 7,000 lb collected gives you a 70% collection rate. If 5,600 lb is recycled and 1,400 lb is prepared for reuse, the recycling rate is 80% and the reuse rate is 20%.
Record weights in pounds (lb), then roll totals up to short tons (2,000 lb) for reporting. The key is consistency. If one site uses a different denominator than another, the numbers won’t line up over time or across vendors.
Once those baseline rates are in place, the next step is to break performance out by material and by environmental result.
Material Recovery and Environmental Outcome Metrics
Track recovery by commodity - copper, aluminum, steel, circuit boards, glass, and plastics - so you can show what the stream actually produces.
The commodity recovery rate uses the same math as the recycling rate, just at the material level: recovered copper (lb) divided by estimated copper content in collected e-waste (lb), multiplied by 100. Vendors should provide weigh tickets or certificates that show output streams by material. From there, report each commodity stream on its own and as a share of the total output.
Use WARM or a similar model to convert recovered material into CO₂e avoided and energy savings. Put reuse first in that analysis, since refurbishment often leads to better environmental results than recycling alone.
For IT assets, recovery numbers only tell part of the story. You also need security metrics so environmental reporting and compliance stay in sync.
ITAD and Data Security Performance Metrics
The four ITAD metrics that matter most are:
Data sanitization rate: the percentage of data-bearing devices wiped, degaussed, or destroyed to NIST 800-88.
Reuse vs. recycle split: the ratio of assets refurbished and redeployed or resold versus those sent to material recycling. A higher reuse share usually points to better value recovery and lower environmental impact.
Chain-of-custody completion rate: the percentage of assets with full, documented custody from pickup through final processing.
Net processing cost per pound: total processing cost minus any remarketing revenue, divided by total weight. Some organizations also track net value per pound or per device.
Vendors should report these metrics for each shipment, not just once a year. A solid ITAD reporting package includes asset serial lists, sanitization certificates, disposal or recycling certificates, downstream vendor disclosures, and audit records.[20] Without that documentation, you can’t verify chain-of-custody completion.
For California filings, map internal metrics to the required weight totals, shipments, residuals, and CRT conversion rates.[1][21]
How to Build and Use a Universal Metric Framework
Once you’ve picked your metric set, the next job is to make sure every site measures, checks, and reports it the same way. The sequence is simple: standardize definitions, standardize intake, then standardize reporting. Each subsection below walks through one part of that process.
How to Choose and Define Your Core Metrics
Start with the reason you’re tracking the metrics in the first place. Regulatory compliance, ESG reporting, cost control, and risk reduction don’t all push in the same direction. Each one shapes what matters most.
After that, pick a short core set tied to the decision you need to make: total e-waste generated, collection rate, recycling rate, reuse rate, verified data sanitization rate, and CO₂e avoided. Keep the list short. If staff can’t keep it up to date, the framework falls apart fast.
Next, define your system boundaries in writing. Spell out which facilities are included, which asset categories count, and how far downstream tracking goes. That usually means naming items like laptops, desktops, servers, networking gear, monitors, appliances, and batteries. Align those definitions with GRI 306 Waste and U.S. EPA Sustainable Materials Management guidance so reports stay comparable over time. [25][28]
Two rules often slip through the cracks. First, decide whether weights are recorded as received or as net recyclable weight. Second, document exactly how mixed or contaminated loads are handled. If those rules aren’t written down, collection and recycling rates can shift from one site or vendor to another. Use lb for day-to-day operations, then convert rollups to short tons or metric tons for disclosures. [25][27]
Reporting frequency should match the decision it supports. Monthly or quarterly dashboards are a good fit for vendor management and day-to-day tracking. Annual totals are the norm for ESG disclosures. High-risk metrics, especially data destruction, should trigger real-time exception alerts. [23][27]
With definitions locked in, the next step is steady intake and verification.
How to Collect, Verify, and Report the Data
A universal framework only works if intake and verification are handled with the same level of discipline.
Collect weights at every intake point with calibrated scales. Record the date, site, vendor, and asset category for each load. For IT assets, capture serial numbers or barcodes at intake so each device can be tied to its destruction certificate and final disposition record. [24][26]
What happens after the weigh-in matters just as much. Require certificates from recyclers and ITAD providers that show how much material was reused, recycled, sent to energy recovery, or disposed of as residual waste. Keep reuse, recycling, recovery, and residual disposal separate. That’s what keeps the recycling rate open to audit. [27][28]
For verification, start with internal controls:
Dual sign-off on large shipments
Regular reconciliation of vendor weight reports against internal records
Spot-checks on serial numbers
Digital audit trails with timestamps, named personnel, and reasons for any adjustments
This is what lets metrics line up across vendors, locations, and reporting periods. When those metrics feed public ESG disclosures, third-party assurance from an auditor or certification body gives added weight beyond internal review alone. [23][24]
Dashboards tend to work best when they split operational and outcome views. Operational panels show pounds collected by site and category, devices processed, turnaround time, and compliance KPIs. Outcome panels turn those figures into metric tons recovered and metric tons of CO₂e avoided with U.S. EPA WARM. Use role-based access so operations teams can view granular data while executives see validated totals. [24][28]
How Rica Recycling Fits Into This Framework

For Bay Area businesses and schools, Rica Recycling can provide the collection records, asset logs, and downstream documentation needed for these metrics. As a California-compliant, 100% landfill-free electronics recycler and ITAD provider, Rica Recycling documents collection volumes, asset categories, and downstream handling in ways that map directly to the framework.
On the collection and diversion side, Rica Recycling’s pickup and drop-off services generate the weigh-in records and asset logs that feed collection rate and recycling rate calculations.
For ITAD and data security metrics, Rica Recycling issues certificates of data destruction that document the destruction method and scope - weights, asset logs, chain-of-custody records, and destruction certificates. Those records support collection-rate, recycling-rate, and data-destruction reporting. [23]
Those records turn site activity into comparable metrics.
Conclusion: What Organizations Should Track and Why
After all the standards, definitions, and reporting rules, the framework comes down to a small set of metrics that matter most. A metric framework should be simple enough to audit and consistent enough to compare across locations. In practice, that means tracking six outcomes: collection, recycling, reuse, landfill diversion, verified data destruction, and chain-of-custody integrity.[25][29][30][32]
Keep the math clean. Use one denominator, one unit, and one method across every site, then review definitions each year so teams stay aligned.[25][29]
The stakes aren't small. In 2022, only 22.3% of the world's 62 million metric tons of e-waste was formally collected and recycled.[33][34] And in California, violations can reach $25,000 per violation per day.[35]
To check results, use internal audits, vendor reconciliation, and destruction certificates. If the data will appear in public ESG reporting, bring in third-party review.[25][31]
For organizations that need these records day to day, a compliant provider can make the framework much easier to run. For Bay Area organizations, Rica Recycling can support these metrics with California-compliant electronics recycling and ITAD records. That support makes collection, diversion, and destruction metrics easier to document and defend.[22]
FAQs
Which recycling metric should we implement first?
Start with core metrics that give you a baseline for your program. Track the basic volume and weight of the electronics you handle, like total pounds of e-waste collected, and record participation rates.
Once that data is solid, add deeper metrics such as landfill diversion rates and avoided carbon emissions. That gives you a clearer view of your broader impact.
How do we keep recycling metrics consistent across sites?
Use a standard measurement framework with clear, documented calculation steps. Group products into consistent categories, such as the UNU-KEYs system, so product lifetimes, material mix, and weights are mapped the same way at every site.
Rica Recycling supports this with detailed documentation and verified asset tracking, which helps keep data accurate, comparable, and in line with compliance and sustainability benchmarks across facilities.
What records prove chain-of-custody and data destruction?
Keep records for each electronic asset from the moment it’s received through final disposition. The main documents should include certificates of data destruction that confirm NIST 800-88 compliant erasure, along with asset inventory reports listing serial numbers, asset tags, acquisition dates, and device condition.
For clear accountability, also keep personnel logs with timestamps, verification records such as sanitization logs or photos of destruction, and reports that show the final disposition of materials.