
Top 5 Metrics for ITAD Sustainability
If I want to know whether an ITAD program works, I look at five numbers: diversion, CO2e, reuse, material recovery, and data control. Those five metrics show where retired devices go, how much waste stays out of landfill, how much carbon impact is avoided, how many assets stay in use, and whether every data-bearing device was erased and tracked.
Here’s the short version:
- Landfill diversion rate shows how much retired equipment stayed out of landfill.
- Carbon footprint reduction shows avoided emissions from reuse and recycling.
- Reuse and refurbishment rate shows how many devices got a second life.
- Material recovery rate shows how much scrap material went back into supply chains.
- Data security and compliance performance shows whether data destruction and chain of custody held up.
A few numbers from the article stand out:
- Global e-waste hit 62 million metric tons in 2022
- The average data breach cost reached $4.45 million in 2023
- Reuse avoids about 29.83 metric tons of CO2e per ton of laptops, while recycling avoids about 1.07 metric tons CO2e per ton
So the main point is simple: reuse-first programs usually beat recycle-first programs on carbon, landfill diversion, and asset value.
Quick comparison
| Metric | What it measures | Main unit | Why it matters |
|---|---|---|---|
| Landfill Diversion Rate | Share kept out of landfill | % and lbs./tons | Tracks waste outcomes |
| Carbon Footprint Reduction | Avoided CO2e from disposition choices | Metric tons CO2e | Supports Scope 3 reporting |
| Reuse and Refurbishment Rate | Devices repaired, resold, or redeployed | % by device count | Shows circular use |
| Material Recovery Rate | Material sent back into use | % by weight | Tracks metals, plastics, boards, batteries |
| Data Security and Compliance | Erasure, custody, and proof records | %, days, incident count | Tracks data risk and audit trail |
What ties all of this together is simple: good ITAD reporting depends on serial-level records, weight tickets, destruction certificates, and chain-of-custody logs. Without that paper trail, the numbers do not mean much.
Circular Technology in IT Asset Disposition | The Future of Sustainable ITAD
sbb-itb-855056e
Why ITAD Metrics Matter
ITAD metrics matter because they turn end-of-life handling into something you can measure. They give companies hard ESG and risk data instead of loose claims. Without metrics, sustainability statements are hard to prove. That’s why traceable operating data sits at the center of reporting you can stand behind.
The records behind that work matter just as much as the final numbers. Serialized records, chain-of-custody logs, and certificates of destruction support both auditability and metric reporting. That same traceability also helps with emissions reporting.
ITAD metrics also tie day-to-day disposal choices to Scope 3 emissions tracking, especially waste and end-of-life categories. If a device is refurbished instead of recycled, the avoided CO2e can be tracked as part of broader climate disclosures. In plain terms, one handling decision can show up in more than one report.
There’s also a direct money angle here. The average data-breach cost was $4.45 million in 2023. So when a company tracks data destruction compliance, it isn’t just checking a box. It’s tracking a form of measurable risk reduction. Those controls make the five metrics below auditable and comparable. The first metric is landfill diversion rate.
1. Landfill Diversion Rate
Definition and Formula
Landfill diversion rate measures the share of retired IT assets kept out of landfills through reuse, refurbishment, or recycling.
Landfill Diversion Rate = (reused and recycled weight) ÷ total processed weight
Start by setting the scope: which facilities are included, which asset classes count, and what reporting period you're using. That part matters more than it may seem. If one site reports desktops by weight and another reports laptops by unit count, the final number can get messy fast. If you use both methods, label them clearly and keep them separate.
Business ESG Value
This metric shows how much end-of-life equipment avoided landfill disposal. It also helps with Scope 3 waste and end-of-life reporting.
The value becomes clearer when you put it in plain terms. Recycling 1 million laptops saves enough energy to power more than 3,500 U.S. homes for a year. And with global e-waste reaching a record 62 million metric tons in 2022, landfill diversion gives companies a direct way to track their part in a very real problem.
Reporting Data Sources
If you want the number to stand up to review, use the same records for every site and reporting period. That usually includes:
- Certificates of recycling
- Weight tickets
- Bills of lading
- Disposition summaries
Those documents help show that the reported weight matches what was actually processed.
Operational Improvement Levers
The biggest lever is simple: reuse first, recycle second. Extending the life of equipment keeps more material out of the waste stream and can improve the metric at the same time.
It also helps to keep a regular pickup cadence, such as monthly or quarterly, so old devices don't sit in closets for months. That cuts down on storage buildup and lowers battery degradation risk. On the vendor side, working with R2v3- or e-Stewards-certified partners helps confirm that downstream processing has been checked and documented.
Landfill diversion shows where assets went; the next metric shows how much emissions impact those choices created.
2. Carbon Footprint Reduction
Definition and Formula
Carbon footprint reduction in ITAD tracks the CO2e emissions your organization avoids when retired devices are reused or recycled. Put simply, it shows how each disposition choice changes the climate impact of your ITAD program.
Use this formula:
Net CO2e Impact = (Avoided emissions from reuse + Avoided emissions from recycling) − (Transportation + Processing emissions)
In most cases, transportation and processing add only a small slice of total emissions. So the net figure helps you see whether reuse choices are producing actual climate gains.
Business ESG Value
IT asset disposal falls under Scope 3, Category 5 emissions. That means ITAD sits squarely inside carbon disclosure work. The level of impact depends on the device mix. Large fleets of servers, laptops, and network gear can produce material CO2e savings.
If you want reporting that holds up under scrutiny, the math needs to tie back to asset-level records. Otherwise, the numbers can drift from what happened on the ground.
Reporting Data Sources
Good carbon reporting starts with three things:
- A serialized inventory
- Verified disposition paths
- Device-level emission factors
When manufacturer data isn't available, use conservative industry averages. Serialized intake and disposition records should support the calculation from start to finish. Once that baseline is in place, the biggest gains usually come from putting reuse ahead of recycling.
Operational Improvement Levers
The clearest way to improve this metric is to prioritize reuse over recycling. The gap isn't small. Reuse avoids far more CO2e than recycling: reuse avoids roughly 29.83 metric tons of CO2e per ton of laptops processed, while traditional recycling avoids about 1.07 metric tons CO2e per ton.
3. Reuse and Refurbishment Rate
Definition and Formula
Carbon footprint reduction tells you the outcome. Reuse and refurbishment rate tells you the action behind that outcome.
This metric measures the share of retired devices that are repaired, resold, or redeployed instead of being recycled or sent to a landfill. The formula is:
(Number of devices entering reuse channels ÷ Total number of processed devices within the reporting boundary) × 100
Report this metric by device count, not by weight. That keeps it separate from landfill diversion rate. To calculate it the right way, businesses need to spell out the reporting boundary up front, including which facilities, business units, and asset classes, such as laptops, servers, and mobile devices, are included.
Business ESG Value
Reuse keeps devices in service longer and supports circularity. A higher reuse rate means fewer devices end up in the waste stream and more keep doing useful work.
With 90% of S&P 500 companies now releasing ESG reports, a documented reuse rate gives sustainability teams hard numbers to back up circularity claims. It shows, in plain terms, how well the program preserves the remaining life of each device.
Reporting Data Sources
To track this metric, use records tied to each asset, including:
- Serialized intake logs
- Resale records
- Redeployment records
- Asset-level destruction certificates
Keep these records in one central repository. That makes chain of custody easier to show and helps with audit readiness.
Operational Improvement Levers
A reuse-first hierarchy can make a big difference. Redeploy or resell devices before sending them to recycling. That simple shift keeps more equipment in use.
It also helps to standardize repair decisions with fixed cost thresholds for common fixes, such as battery or SSD replacements. Without that kind of rule, teams often waste time debating low-stakes repairs or scrap devices too early.
Quarterly collection cycles matter too. If old assets sit in storage for months, they can lose resale value and fall into worse condition. Regular collection helps prevent that buildup.
Before any device is reused, require NIST 800-88-compliant data sanitization. Certified erasure removes one of the biggest barriers to reuse: data-security risk.
Once reuse is measured cleanly, the next question is how much material the program actually recovers.
4. Material Recovery Rate
Definition and Formula
When an asset can't be reused, the next question is simple: how much of it can still make its way back into the supply chain? That's what material recovery rate measures.
It shows the share of material recovered from retired IT assets and sent back into supply chains. The formula is straightforward:
(Total weight of materials recovered for recycling ÷ Total weight of assets processed) × 100
Track recovered material by weight, then report the result as a percentage. It also helps to split the data by device category, such as laptops, servers, and networking gear, and by disposition path. That gives you a clearer view of how recovery changes across each stream.
Business ESG Value
E-waste contains gold, silver, palladium, platinum, copper, aluminum, and rare earth elements. Recovering those materials cuts demand for virgin extraction and supports circular economy goals.
This metric also lines up with GRI 306-2 (Waste by Disposal Method), GRI 301-3 (Reclaimed Products), and SDG 12 on Responsible Consumption and Production. So from an ESG reporting angle, it gives teams a solid way to show what happens after assets leave service.
Reporting Data Sources
Good measurement depends on downstream records that follow material through final processing. In practice, that usually means pulling data from:
- Certificates of Recycling
- Downstream weight tickets
- Serialized intake logs
- Processor attestations for final material destinations
If those records are weak or incomplete, the metric gets shaky fast.
Operational Improvement Levers
Two practices tend to improve recovery the most. First, salvaging high-value components from non-functional devices before shredding can increase total recovery yield. Think of it as pulling out the parts with the most upside before the rest of the device goes into the scrap stream.
Second, working with R2v3- or e-Stewards-certified downstream processors helps document chain of custody through final processing. That matters not just for reporting, but for knowing where material actually ends up.
It also helps to define which asset classes and streams are in scope before calculating the metric.
5. Data Security and Compliance Performance
Definition and Formula
The last test of sustainable ITAD is simple: every device needs to leave the process with its data under full control. This metric tracks how well your ITAD program protects sensitive information during disposition. It also shows whether you can prove compliance when someone asks for the paper trail.
There are four core measurements to track:
- Data Destruction Compliance Rate: (Number of devices with certified destruction ÷ Total data-bearing devices processed) × 100
- Chain of Custody Accuracy: (Assets with complete documentation ÷ Total assets processed) × 100
- Security Incident Rate: Number of data-security breaches recorded during the reporting period (target: zero)
- Mean Time to Erasure: Average number of days from asset pickup to certified data destruction
Business ESG Value
Secure handling protects the credibility of every sustainability metric above. If the data side falls apart, the rest of the story does too. In ESG terms, data security sits in the Social and Governance pillars because it helps protect stakeholder information and shows that real controls exist.
The money at risk is not small. The average cost of a data breach in 2023 was $4.45 million. One breach can wipe out the ESG value of an otherwise strong ITAD program.
Reporting Data Sources
Good performance here depends on device-level records, not bulk summaries. You need records that tie each action back to a specific asset. That usually includes Certificates of Data Destruction (CoDD) linked to individual serial numbers, signed transfer manifests, erasure software logs that confirm NIST-compliant pass/fail status, and third-party audit results from NAID AAA- and R2v3-certified partners. Together, those records close the audit trail.
Store every record in one controlled repository. That way, each claim can point back to a serial number, certificate ID, or manifest instead of sitting there as a loose statement.
Operational Improvement Levers
A few process moves make a big difference here. Barcoding devices before transport helps preserve chain of custody from the start. Automated reporting lets audit-ready certificates generate during processing, which cuts manual reconciliation risk. Third-party verification from NAID AAA- and R2v3-certified vendors adds another layer of trust.
Use a certified ITAD partner that provides serialized reporting, data-destruction certificates, and audit-ready chain-of-custody records. When custody, destruction, and reporting stay in sync, the sustainability record is much easier to defend.
Landfill Diversion Rate Benchmarks
These ranges help you tell whether an ITAD program is mature, getting better, or falling short.
Landfill diversion rate = ((processed weight − landfilled weight) ÷ processed weight) × 100.
A 100% landfill-free target is a strong sign of a mature ITAD program. In practice, that usually depends on reuse-first routing, certified downstream partners, and serialized chain-of-custody records. Rica Recycling, for example, operates under a 100% landfill-free policy, with devices routed to reuse or certified recycling.
Here’s what each diversion band tends to look like on the ground:
| Diversion Rate | Performance Level | Common Program Traits | Associated Benefits |
|---|---|---|---|
| 95% – 100% | High (Mature) | 100% landfill-free policy; R2v3/e-Stewards certified partner; reuse-first priority; serialized asset tracking | Strongest ESG reporting and value recovery |
| 75% – 94% | Moderate | Consistent recycling program; some refurbishment; documented chain of custody | Solid compliance and reporting |
| < 75% | Low | Ad-hoc disposal; uncertified vendors; incomplete documentation; scrap-heavy outcomes | High compliance risk and weak ESG impact |
A 96% result, for instance, lands in the high-performance band. Usually, the higher the diversion rate, the more material is being reused and the less is headed to landfill. That difference matters, and the next section ties each path to its CO2e effect.
For clean reporting, use consistent lbs.-based weight tickets, certificates of recycling, and bills of lading. Leave out shipments with incomplete paperwork, since estimates can weaken audit readiness.
These diversion bands show how much material stayed out of disposal; the next section translates those choices into CO2e.
CO2e Impact by Disposition Path
The next step is to break down carbon impact by disposition path. This matters because the path you choose changes the CO2e result in a big way: reuse avoids the most emissions, recycling avoids some, and landfill avoids none.
Reuse or resale avoids most of the manufacturing footprint. Certified recycling avoids less. Landfill avoids none.
| Disposition Path | Relative CO2e Impact | Scope 3 Relevance |
|---|---|---|
| Reuse / Resale | Highest - avoids nearly all of the manufacturing footprint, minus about 2–5% for logistics | Strongest lever for reducing Category 5 emissions |
| Certified Recycling | Moderate - avoids about 10–30% of the manufacturing footprint through material recovery | Helps prevent embedded carbon in raw materials from being wasted |
| Landfill | No avoided emissions | Highest carbon burden |
Transportation and processing usually add only a small share of total emissions. So even after you account for those steps, a reuse-first program still delivers a strong net carbon result.
For ESG reporting, use partner impact reports that include verified CO2e avoidance and landfill diversion data.
That gap helps explain why reuse-first programs beat recycle-first programs.
Reuse-First vs. Recycle-First ITAD Performance
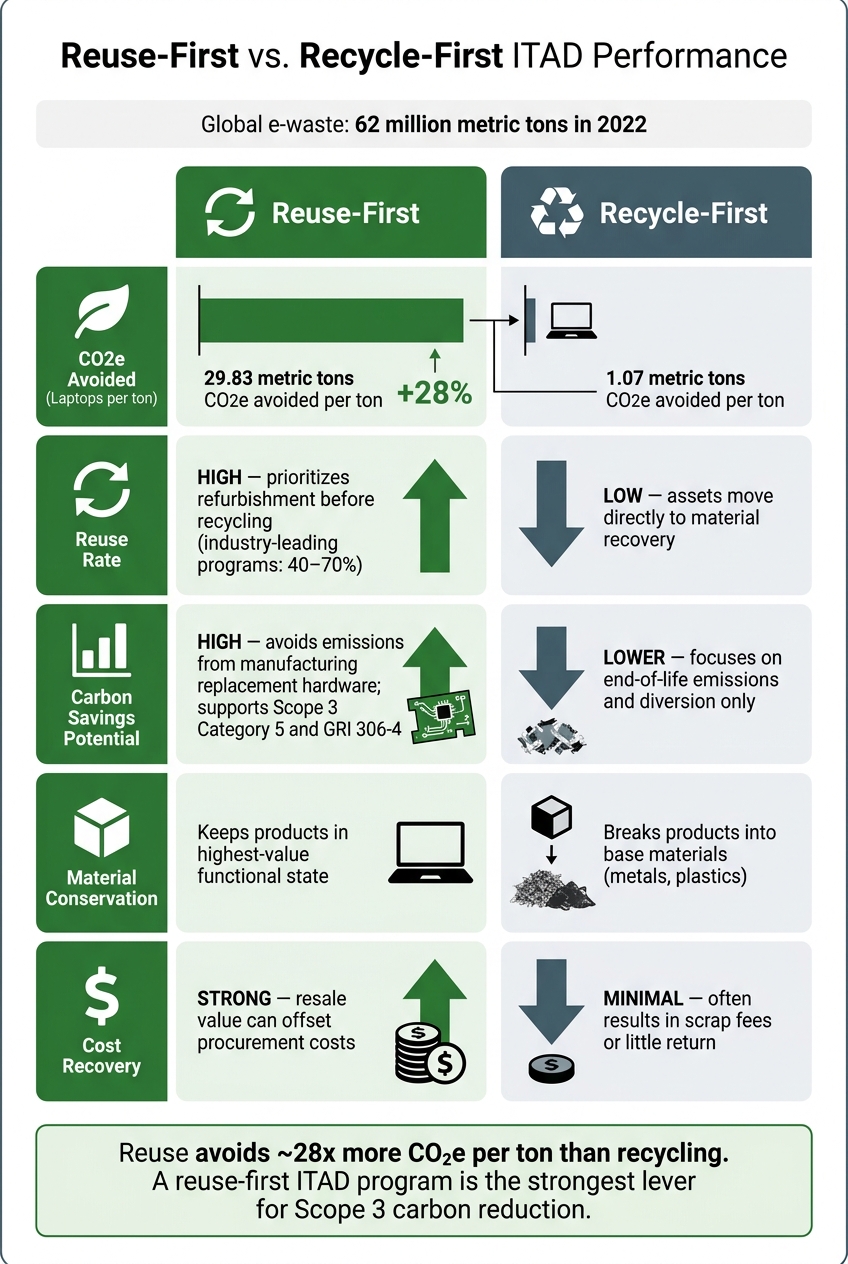
Reuse-First vs. Recycle-First ITAD: Key Sustainability Metrics Compared
Reuse-first is the operational choice that most directly improves reuse rates and carbon results.
It tends to deliver stronger sustainability outcomes because it puts refurbishment, redeployment, or remarketing first. Devices stay in use before anything moves into the recycling stream. That matters because reuse keeps the product's embodied value in play, while recycle-first usually recovers raw materials and little else.
Refurbishment keeps embodied energy in the product. Recycling can recover metals and plastics, but it ends the product's useful life and adds processing energy.
Reuse can also improve cost recovery. Refurbished devices may be resold, while recycled devices often bring in little return and can even come with disposal fees. Reuse-first also gives stronger support for Scope 3 Category 5 reporting and GRI 306-4 disclosures than recycle-first.
On the main sustainability metrics, reuse-first programs consistently outperform recycle-first programs.
The gap shows up clearly across the core ITAD metrics.
| Metric | Reuse-First | Recycle-First |
|---|---|---|
| Reuse Rate | High; prioritizes refurbishment before recycling | Low; assets move directly to material recovery |
| Carbon Savings Potential | High; avoids emissions from manufacturing replacement hardware - supports Scope 3 Category 5 and GRI 306-4 | Lower; focuses on end-of-life emissions and diversion |
| Material Conservation | Keeps products in their highest-value functional state | Breaks products into base materials such as metals and plastics |
| Cost Recovery | Strong; resale value can offset procurement costs | Minimal; often results in scrap fees or little return |
Those differences are what the next section quantifies in landfill diversion and CO2e.
Material Recovery by Stream
Overall MRR tells you how much material gets recovered across the whole program. Stream-level MRR shows where recovery is strongest and where things start to fall apart. If you track MRR by stream, you can spot which materials are recovered well and which ones are getting lost because of weak sorting, reuse decisions, or poor downstream handling.
This view also helps you judge how well downstream processors keep hazardous materials out of the waste stream. Different streams have different recovery rates, and the upside isn’t the same across the board. Circuit boards can recover precious metals like gold, silver, and palladium. Batteries can reclaim lithium and cobalt for new battery manufacturing. And certified downstream processing helps keep lead, mercury, cadmium, and brominated flame retardants out of the environment while staying in line with EPA rules.
Break MRR out by stream if you want a clearer read on what’s shaping your sustainability results. In plain terms, this helps you see whether the issue is reuse, sorting, or processor selection.
| Material Category | Typical Recovery Range | Associated Benefits |
|---|---|---|
| Ferrous Metals | 95% – 99% | Cuts the need for virgin iron ore mining; saves a lot of energy in smelting |
| Non-Ferrous Metals | 95% – 98% | Reclaims copper and aluminum; cuts habitat damage from mining |
| Plastics | 70% – 85% | Keeps petroleum-based materials out of landfills; supports circular manufacturing |
| Circuit Boards | 90% – 98% | Recovers precious metals (gold, silver, palladium); helps prevent toxic leaching |
| Batteries | 70% – 95% | Safely recovers lithium, cobalt, and nickel; helps prevent hazardous chemical fires and soil contamination |
When results fall below these ranges, that usually points to poor sorting or weak downstream processing.
Use stream-level MRR to support GRI 301-3, GRI 306-2, and Scope 3 reporting. Reporting MRR by stream makes it easier to pinpoint weak recovery paths and compare performance across metals, plastics, boards, and batteries.
Stream recovery shows what was reclaimed; the next metric shows how security controls protect the program.
How Data Security Metrics Support ITAD Sustainability
Data security and sustainability are tightly linked in ITAD. In plain English: better data controls help more devices stay in circulation. If an organization can prove data was removed, it can send more assets to reuse and resale instead of defaulting to shredding.
The key metrics fall into three functional groups:
- Proof of erasure: verified destruction rate and erasure pass rate
- Chain-of-custody proof: serial-number coverage and CoD coverage
- Compliance rate: alignment with standards such as NIST SP 800-88 Rev. 1 and R2v3
Erasure pass rate is the strongest sustainability signal here. When teams use software-based wiping under NIST 800-88, the hardware stays physically intact. That matters because intact devices can still be refurbished, resold, or donated. Add serial-numbered CoDs, and those reuse calls become much easier to defend. Legal, compliance, and sustainability teams all get the same auditable record for each device. Industry-leading ITAD programs achieve reuse rates of 40–70% when assets are handled through certified refurbishment channels.
The day-to-day outcome is pretty simple: the better the proof of data removal, the less hardware gets shredded, highlighting the importance of electronic recycling. Strong controls like serialized CoDs, NIST 800-88 erasure logs, and R2v3 and NAID AAA certification support high reuse rates and help organizations reach 100% landfill diversion through certified partners.
On the flip side, weak controls create the opposite result. If a program relies on bulk weighing and has no serial tracking, more assets get pushed toward shredding. It also leaves chain-of-custody gaps, which can increase regulatory risk under GDPR, HIPAA, and CCPA.
For ESG reporting, erasure pass rate and CoD coverage help support Scope 3 Category 5 and GRI 306 waste reporting. That device-level proof is the kind of record a certified ITAD partner should capture and include in reporting.
Tracking These Metrics with a Certified ITAD Partner
These metrics only mean much if one partner records them the same way, every time. A certified ITAD partner does that work and turns the numbers into auditable records. Instead of pulling data from scattered sources, you get one dataset that covers pickup, tracking, destruction, and downstream documentation.
The big win here is serial-level chain-of-custody records. That level of tracking ties each asset’s disposition path directly to the metric being reported. It also gives teams the documentation they need for ESG reporting under GRI 306, SASB, and CDP.
For businesses in the San Francisco Bay Area, Rica Recycling offers certified electronics recycling, IT asset recovery, and secure data destruction with the records shown below.
Once those records are in place, each metric gets much easier to audit and compare. This table shows what a partner should provide for each one:
| Metric Category | Documentation a Partner Should Provide |
|---|---|
| Landfill Diversion | Total weight processed, diversion rate, weight by disposition channel |
| Carbon Footprint | Avoided CO2e from reuse and recycling |
| Reuse & Material Recovery | Device reuse rate (%), materials recovered by stream |
| Data Security & Governance | Certificates of data destruction, erasure logs, chain-of-custody records |
When you evaluate a partner, check for active certifications. That includes R2v3 or e-Stewards for handling electronics, plus NAID AAA or NIST SP 800-88-aligned processes for data security. Those standards help make the documentation auditable. If security records, custody logs, and disposition data don’t match, the metrics won’t hold up.
Conclusion
Taken together, these five KPIs show the full picture of ITAD performance. They help you see if ITAD is lowering impact, extending device life, and protecting data. That turns ITAD from a back-office task into something you can track as part of ESG and risk control.
These metrics also support ESG reporting tied to GRI 306, SASB, and Scope 3 disclosures. And that reporting rests on day-to-day results: reuse avoids far more emissions than recycling, and a reuse-first approach improves landfill diversion, carbon savings, and material recovery across the same KPIs covered in this article.
For Bay Area organizations, Rica Recycling provides certified electronics recycling, ITAD, secure data destruction, and a 100% landfill-free process.
Put simply, better ITAD data turns sustainability claims into measurable performance. Use these KPIs to review vendors, check reporting, and improve results in the next cycle.
FAQs
Which ITAD metric should I track first?
Start with the total weight of e-waste diverted from landfill, often reported as the landfill diversion rate. It gives you a clear baseline for waste management and helps support ESG reporting frameworks like GRI 306.
When you track the total weight of equipment processed through certified channels, you get a direct, measurable signal of impact. Rica Recycling supports this with a 100% landfill-free policy and transparent documentation.
How do I verify ITAD sustainability data?
Verify ITAD sustainability data with clear, well-documented reporting from certified recyclers. That should include detailed environmental impact statements, not vague claims or high-level summaries.
To keep data audit-ready, maintain a complete chain of custody for each asset. Record serial numbers at origin, and keep signed manifests, Certificates of Destruction, and recycling weight tickets on file. It also helps to line up your internal tracking with frameworks like R2v3 or NIST SP 800-88.
Why does reuse beat recycling in ITAD?
Reuse has a bigger impact because it keeps a device in use longer through refurbishment or redeployment. That helps avoid the energy use and raw material extraction that come with making new electronics.
Recycling still matters for equipment that no longer works. But reuse keeps more of the hardware’s current value in play. In turn, it can cut carbon emissions and reduce the need for new production.